Movement in the median price and the volume of sales for houses and apartments in Pymble for each quarter from the start of 2014 to the end of September 2015
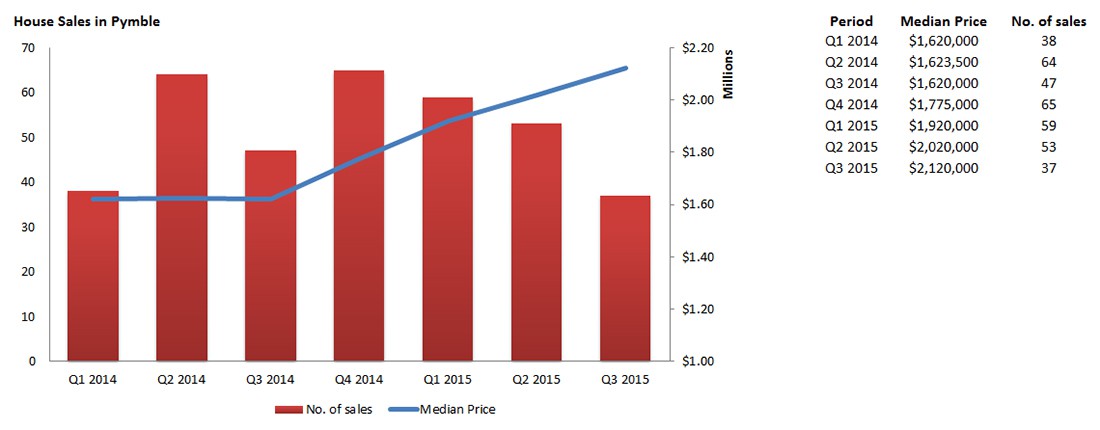
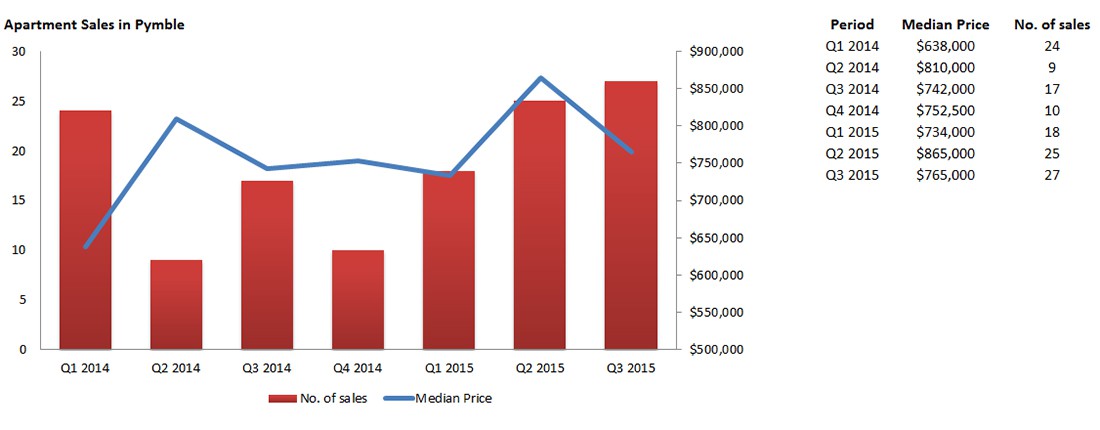
The graphs below show the movement in the median price and the volume of sales for houses (the first image) and apartments (the second image) in Pymble for each quarter from the start of 2014 to the end of September 2015.
No surprises to see the median house price growing steadily from Q3 2014 with the volume of sales on a downward trend (a reflection of the tight stock levels throught this period). Amazing growth in the median price of $500k in just 18 months! It will be very interesting see how things change in this last quarter given stock levels have risen and auction clearance rates fallen.
There are some big variations in the number of sales of apartments through this period and there are still a number of sales in new develpments that are yet to be reported. Despite this, there is a definite upward trend in the median price and I wouldn't be suprised to see this continue in the last quarter.

by Josh Luschwitz in Latest News
Share This Post
Archived Posts
- September 2021 (1)
- July 2021 (1)
- June 2021 (1)
- April 2021 (1)
- March 2021 (2)
- February 2021 (2)
- December 2020 (4)
- April 2019 (1)
- December 2018 (1)
- November 2018 (4)
- October 2018 (3)
- September 2018 (4)
- August 2018 (9)
- July 2018 (8)
- June 2018 (6)
- May 2018 (8)
- April 2018 (3)
- February 2017 (2)
- January 2017 (3)
- November 2016 (2)
- October 2016 (3)
- September 2016 (3)
- August 2016 (3)
- July 2016 (2)
- June 2016 (3)
- May 2016 (4)
- April 2016 (4)
- March 2016 (4)
- February 2016 (2)
- January 2016 (2)
- November 2015 (3)
- October 2015 (1)